
Climate Change

Climate change risk is an important risk that businesses cannot afford to ignore. By publishing the TCFD report, TBB expects to facilitate understanding of the environmental, social, and governance importance of climate risk and call attention to the urgency of climate action.
In response to the risks and opportunities arising from extreme weathers, natural disasters, energy crises, and low carbon economy transition, TBB started following the FSB TCFD recommendations and the FSC Guidelines for Domestic Banks' Climate Risk Financial Disclosure to implement climate-related risk and opportunity management. March towards the Paris Agreement and the target of keeping the temperature increase to within 1.5°C above pre-industrial levels. Implement Science Based Targets (SBTs) with Net Zero by 2050 as the vision. Set practical net zero targets and work actively to reduce own carbon emissions and modify asset allocation in investing/financing activities. Exercise influence as a financial institution to increase climate resilience and join the effort to create a net zero future.


This report is prepared in accordance with the Guidelines for Domestic Banks' Climate Risk Financial Disclosure released by the Financial Supervisory Commission ("FSC") and the Task Force on Climate-Related Financial Disclosures ("TCFD") created by the Financial Stability Board ("FSB"). It is also based on the Best Practices in Climate Risk Management by Domestic Banks published by the Bankers Association of The Republic of China as well as the four pillars, governance, strategy, risk management, and metrics and targets.
| Aspects | Details |
|---|---|
| Governance |
|
| Strategy |
|
| Risk Management |
|
| Metrics and Targets |
|
Matrix of Climate Change-related Risk Issues


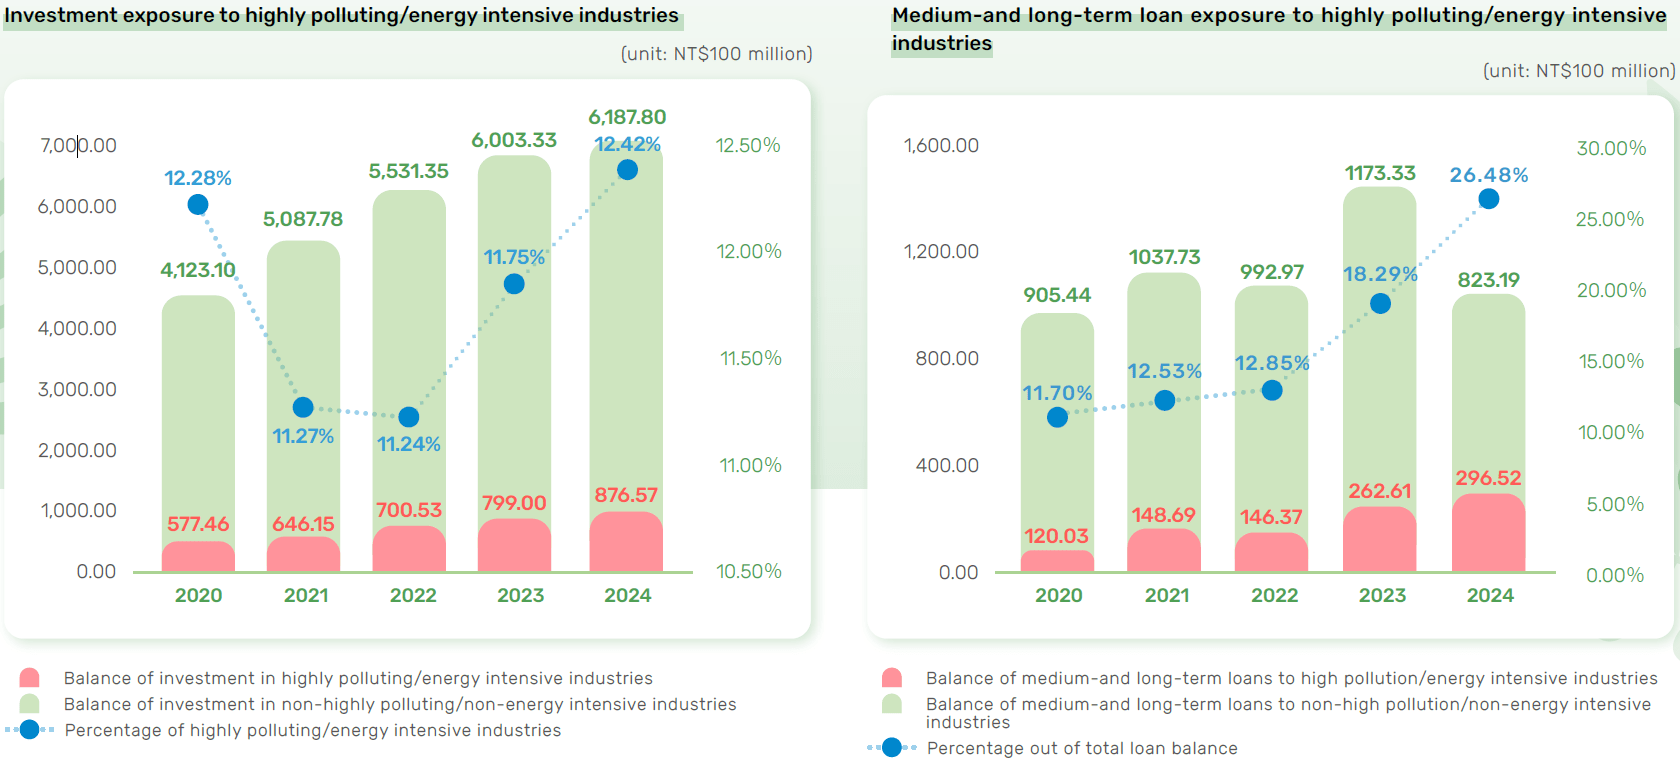
As the world moves towards net zero, carbon intensive industries will face the first wave of transition related policies and regulations as well as more severe challenges in fund utilization and market competition. TBB classifies printing and dyeing, leather manufacturing, paper manufacturing, oil and refinery, basic chemical materials manufacturing, manmade fibers, cement, steel, metal processing semiconductors and optoelectronic, power supply, and marine/air transport industries as high pollution/ energy intensive industries.
The outstanding balance of medium- and long-term loans to the high polluting/energy intensive industries was NT$87.7 billion in 2024, which accounted for 12.41% of the total outstanding balance of medium- and long-term loans. The investment is NT$29.7 billion or 26.48% of total investment and is classified as carbon asset exposure. The trend of the loan and investment balance and distribution for the Bank in the last three years are shown as follows:
TBB considers including carbon fees as a factor in the internal credit rating assessment for borrowers, measuring changes in customers' default risk, and analyzing changes in expected losses from credit risk in the future.
- Risk identification:
38 of the regulated businesses on the Mandatory Greenhouse Gas Reporting System of the Environmental Protection Administration of the Executive Yuan are borrowers at TBB. - Risk Analysis:
Carbon intensive industries will face increasingly restrictive low carbon regulations in the future, such as collection of carbon tax/fee and impact on operational and profit performance from production equipment replacement and other transition risks. They can lead to difficult debt recovery and have an impact on TBB's expected losses from credit risk. - Assumptions:
The assessment is based on the Network for Greening the Financial System (NGFS) model:- NDCs (Climate Change Response Act)
- Delayed transition
- 2050 global net zero
- Assessment Results:
The degrees of financial impact of potential increases in credit losses are shown in the table below.
| NGFS scenario (Financial impact amount: NT$ million) | 2025 | 2030 | 2050 |
|---|---|---|---|
NCDs (Climate Change Response Act) |
Moderate (1.34) |
Moderate (1.34) |
Moderate (1.34) |
Delayed transition |
- |
- |
High (46.17) |
2050 net zero |
Moderate (9.81) |
High (49.74) |
High (41.43) |
For the purpose of understanding its exposure to physical risk in different regions, TBB performed physical risk scenario analysis on all business activities in 2021 based on the Taiwan Disaster Risk Map published by the NCDR climate change disaster risk mitigation platform. In order to refine the precision of climate risk analysis types, ranges, and hazards for an accurate overview of physical risk exposure, TBB adopted the UNEP FI recommended external climate risk database in 2022 and implemented climate physical risk database and damage models, which expanded the scope of physical risk quantification to cover all offices and real estate collaterals in Taiwan.
- Risk identification:
- Offices: Conduct a physical risk analysis on all offices and own real estate in Taiwan.
- Real estate collaterals: Conduct a physical risk analysis on all domestic real estate collaterals.
- Risk Analysis:
- Extreme heat, Coastal flooding, Land subsidence, River flooding, Extreme winds, Forest fire
- Assumptions:
Enter parameters: Address of real estate, economic service life of building, material of building, and year of construction. - Analysis method:
- General Circulation Models:Choose IPCC AR5 CMIP5 and IPCC AR6 CMIP6 projection of global temperature increase.
- Regional Climate Models: Analyze regional climate models for specific physical risks and disasters.
- Assessment Results:
1. Assessment Results:
| 2050 scenario | SSP 5-8.5 | SSP 1-2.6 |
|---|---|---|
| Financial impact (NT$ million) |
31.76 High |
28.11 Moderate |
2. Real estate collaterals:
| 2050 scenario | SSP 5-8.5 | SSP 1-2.6 |
|---|---|---|
| Financial impact (NT$ million) |
7,438.41 Extremely high |
6,542.37 Extremely high |
| Change in LTV ratio (%) | 0.40% Slight change |
0.35% Slight change |
Note: Real estate value impairment (%): based on UNEP FI recommended external climate risk database.

Two offices located at Taichung are identified by the Bank with high physical risks, which will be possible business disruption caused by climate disasters (e.g. flooding disasters caused by extreme rainfall). However, they may only cause a mild financial impact, therefore, the Bank’s priority is to ensure the office’s operation as usual.
- Short, and Medium-Long term Response Plan:
- Short term (within 2 years)
- According to the notification of severe weather events (e.g. disastrous heavy rains, typhoons, etc.) from Central Weather Administration, the offices should immediately activate the response plan, including safety notifications, stacking sandbags, checking waterproof gates, and preparing water pumps, etc.
- In order to reduce property losses, the supplementary measures will be adopted, such as temporarily closing underground parking lots and moving vehicles out of basements.
- When the disaster loss reaches a certain amount or causes operation interruption, it will be handled in accordance with the Bank's “Disaster Emergency Response Countermeasures Manual”.
- Medium to long term (2-5 years)
- Regularly conduct physical risk assessments of buildings and offices every year, and incorporate into the consideration of the facility repair plan.
- Continuously collect the information about the type, frequency, and degree of financial impact of extreme weather events in buildings and offices, as a reference for building relocation.
- Short term (within 2 years)
- The Bank has formulated “Real estate location rating form” for the location of real estate collaterals, which is divided into four levels: A, B, C and D, and makes physical climate risk as one of change factors in the Bank's real estate location rating form.
- For the collected collaterals, we consider the price impact factors of different regions during the appraisal process. Generally, real estate is less likely to be damaged or lost due to natural disasters caused by abnormal weather. For ecological reserves or environmental conservation area that are prone to the above-mentioned conditions, it has been stipulated in the Bank's “Guidelines for Real Estate Collateral Appraisal” and “Procedures for Real Estate Collateral Appraisal” that they shall not be taken as collateral.
- For new applications, trends of physical risk in regions in which real estate collaterals are located are made one of the ESG risk factors. Those deemed a "high physical risk" are managed according to the Responsible Lending Guidelines and be required to undergo regular review of local climate disasters every year in order to monitor the physical risk exposure.
- The physical risk information of the real estate collaterals location has been established in the Bank's collateral system. When conducting real estate appraisal operations, business units should introduce the physical risk information as a reference for the valuation of real estate collateral.
Carbon emissions from investment/financing activities are calculated according to the PCAF methodology to assess the potential impact of climate change risk on the investment/financing portfolios. TBB actively explores opportunities to reduce GHG emissions.
In 2023, total Scope 3 GHG emissions by the Bank was 1,571,133.96 tonne CO2e and total carbon footprint was 5.84 tonneCO2e/NT$ million investment or financing. The scope covered emissions from medium- and long-term loans, power generation project financing, commercial real estate loans, and equity and bond investment portfolios. The asset inventory categories will be expanded by the new PCAF methodology to better monitor overall carbon emissions from financial assets.
| Item | 2021 | 2022 | 2023 | 2024 |
|---|---|---|---|---|
| Financed carbon emissions(tonneCO2e) | 1,131,450.31 | 1,273,195.11 | 1,571,133.96 | 2,180,970.08 |
| Carbon emission intensity (tonneCO2e/NT$mn investment or financing) | 5.48 | 5.95 | 5.84 | 3.31 |
| Data quality score | 2.10 | 2.83 | 1.70 | 3.22 |
| Total percentage out of investment/financing portfolios* | 11.60% | 11.69% | 11.39% | 31.17% |
Note * :TBB sets carbon reduction targets based on the SBT approach and takes inventory of the asset categories that must be included for 2022 and 2023. The scope covers TBB and its subsidiaries. The scope covers sovereign debt and mortgage loans following the PCAF methodologies in 2024.
| Financed carbon emissions by asset category (tonneCO2e) |
2021 | 2022 | 2023 | 2024 |
|---|---|---|---|---|
| Corporate loans | 277,783.06 | 337,354.85 | 465,378.17 | 919,006.06 |
| Equity and corporate bond investments | 804,296.16 | 869,638.53 | 1,047,261.23 | 853,781.21 |
| Power generation project loans | 12,401.39 | 11,884.66 | 38,262.13* | 117,927.79** |
| Commercial real estate loans | 38,969.70 | 54,317.07 | 20,232.44 | 10,849.60 |
| Sovereign debt (excluding LULUCF) |
- | - | - | 90,149.95 |
| Sovereign debt (including LULUCF) |
- | - | - | 88,102.71 |
| Mortgage loans | - | - | - | 101,152.78 |
Note * : Financed emissions and the carbon emission intensity rose significantly due to the addition of a new power generation project loan in 2023.
Note **: Two asset categories, “commercial loans - general power generation” and “power generation project loans”, were reclassified according to the corporate borrowers' “purposes of fund”. As a result, one corporate borrower was reclassified from general power generation to power generation project loans, leading to a significant increase in financed emissions and carbon emission intensity for “power generation project loans”.
| Carbon emission intensity by asset category (tonneCO2e/NT$ million investment or financing) |
2021 | 2022 | 2023 | 2024 |
|---|---|---|---|---|
| Corporate loans | 3.79 | 3.71 | 4.06 | 5.84 |
| Equity and corporate bond investments | 6.45 | 7.66 | 7.25 | 4.69 |
| Power generation project loans | 12.69 | 5.79 | 16.75* | 39.70** |
| Commercial real estate loans | 5.06 | 4.91 | 2.69 | 1.15 |
| Sovereign debt (excluding LULUCF) |
- | - | - | 7.32 |
| Sovereign debt (including LULUCF) |
- | - | - | 7.16 |
| Mortgage loans | - | - | - | 0.35 |
Note * : Financed emissions and the carbon emission intensity rose significantly due to the addition of a new power generation project loan in 2023.
Note **: Two asset categories, “commercial loans - general power generation” and “power generation project loans”, were reclassified according to the corporate borrowers' “purposes of fund”. As a result, one corporate borrower was reclassified from general power generation to power generation project loans, leading to a significant increase in financed emissions and carbon emission intensity for “power generation project loans”.
| Data quality score by asset category | 2021 | 2022 | 2023 | 2024 |
|---|---|---|---|---|
| Corporate loans | 1.98 | 2.17 | 2.05 | 3.15 |
| Equity and corporate bond investments | 1.18 | 1.28 | 1.24 | 1.79 |
| Corporate bonds | 2.14 | 1.34 | 1.31 | 2.33 |
| Power generation project loans | 2.00 | 2.00 | 2.00 | 2.00 |
| Commercial real estate loans | 4.00 | 4.00 | 4.00 | 4.00 |
| Sovereign debt (excluding LULUCF) | - | - | - | 2.00 |
| Sovereign debt (including LULUCF) | - | - | - | 1.02 |
| Mortgage loans | - | - | - | 4.00 |
| Distribution by industry in 2024 | Financed carbon emissions (tonneCO2e) |
Carbon emission intensity (tonneCO2e/NT$mn investment or financing) |
|---|---|---|
| Support activities for transportation | 597,238.70 | 142.27 |
| Power supply industry | 531,601.02 | 46.64 |
| Other non-metallic mineral products manufacturing | 224,412.62 | 71.50 |
| Mining of oil and natural gas | 173,036.94 | 67.28 |
| Computers, electronic products and optical product manufacturing | 91,189.31 | 11.06 |
| Other | 155,308.67 | 0.70 |
Note : Calculation of financed carbon emission and emission intensity by industry does not cover "power generation project loans", "commercial real estate loans", “sovereign debt”, or “mortgage loans”.
| Distribution by geographic region in 2024 | Financed carbon emissionsn (tonneCO2e) |
Carbon emission intensity (tonneCO2e/NT$mn investment or financing) |
|---|---|---|
| Taiwan | 1,254,104 | 7.21 |
| Australia | 240,835 | 10.84 |
| Philippines | 69,380 | 12.19 |
| India | 62,147 | 4.00 |
| Saudi Arabia | 41,166 | 10.80 |
| United States | 35,945 | 0.92 |
| Other | 80,190 | 0.89 |
Note : Calculation of financed carbon emission and emission intensity by industry does not cover "power generation project loans", "commercial real estate loans", “sovereign debt”, or “mortgage loans”.
| Mid-term targets (2030) | Long-term targets (2050) |
|---|---|
Financial emissions of investment and lending portfolios will keep global temperature increase to well-below 2°C. |
Follow the "Taiwan 2050 Net-Zero Emission Pathway and Strategy" and move towards the net-zero emission goal. |